|
Data Visualisation
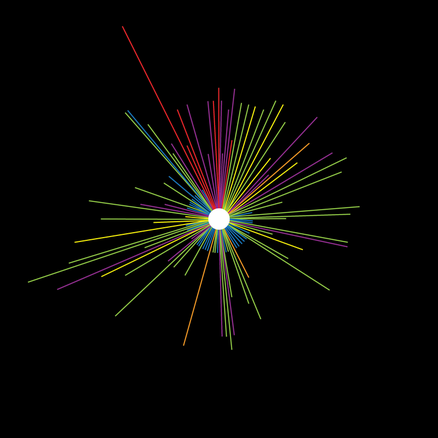
Research | Graphic Design Data Visualisation is a beautiful and artistic way to present data. The left data visualisation depicts the Distance, relationship and age of 100 of my own Facebook friends. Working around the circle clockwise shows the age of friends, the colour representing the individuals relationship to me and the length symbolise's the distance between the individual and myself. |
Contact |
|